OFFIX — Office Furniture & Workspace eCommerce Store (offix.us)
Niche: Office furniture, ergonomic seating, desks, and workspace accessories Platform: Shopify · Launched: 2025 · Primary market: United States Trading history: October 2025 – July 2026 (10 active trading months)
Business Overview
OFFIX is a Shopify store selling office furniture and workspace products across four categories: Office Desks & Tables, Office Chairs, Equipment & Organizers, and Accessories & Decor. The catalogue spans a wide price range — from £12 desk accessories to £900+ designer desks — with an average order value of $386.07.
The store is supplier-fulfilled, with no owned inventory or warehousing. Products ship directly from established suppliers, and full supplier introductions are included in the sale.
The business operates as a paid-acquisition model, driven by Facebook, TikTok, and Google campaigns, supported by a marketing agency under contract. It reached $303,266 in net revenue and $97,919 in net profit within its first ten trading months.
Financial Performance
All figures are taken from the attached Profit & Loss statement and have been independently reconciled against Shopify Analytics (see verification section below).
2025 (October – December, first trading quarter)
Metric Amount
Net revenue $191,062
Cost of goods $76,716
Total operating expenses $129,056
Net profit $62,006
Net margin 32.5%
2026 year-to-date (January – July)
Metric Amount
Net revenue $112,204
Cost of goods $45,949
Total operating expenses $76,291
Net profit $35,913
Net margin 32.0%
Combined (October 2025 – July 2026)
Metric Amount
Net revenue $303,266
Cost of goods $122,665
Gross profit $180,601 (59.6% gross margin)
Total operating expenses $205,347
Net profit $97,919
Net margin 32.3%
Average across the 10 trading months: $30,327 net revenue and $9,792 net profit per month. 2026 run rate (Jan–Jul, 7 months): $16,029 net revenue and $5,130 net profit per month.
Independent Verification Against Shopify Analytics
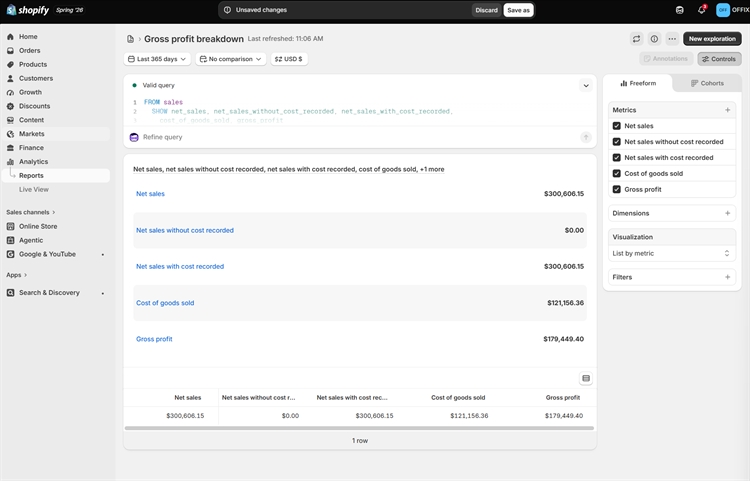
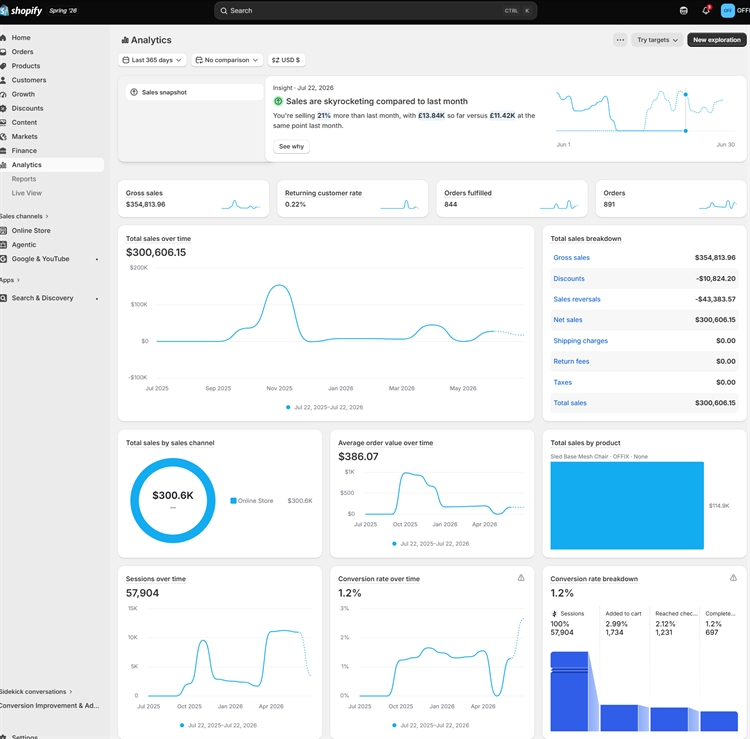
The P&L reconciles to Shopify's reported figures for the trailing 365 days to a variance of under 1%:
Metric P&L Shopify Analytics Variance
Net revenue / net sales $303,266 $300,606 0.9%
Cost of goods sold $122,665 $121,156 1.2%
Gross profit $180,601 $179,449 0.6%
Shopify's trailing-365-day breakdown: gross sales $354,814, less discounts $10,824, less sales reversals $43,384, giving net sales $300,606 across 891 orders (844 fulfilled).
Note on sales reversals: refunds and cancellations totalled $43,384, or 12.2% of gross sales. This is already deducted from all revenue and profit figures above — the reported net profit is net of returns. Buyers should factor this reversal rate into their own modelling, and it represents a clear margin-recovery opportunity (see Growth Opportunities).
Marketing Performance
Channel 2025 2026 YTD Total
Facebook Ads $18,300 $8,800 $27,100
TikTok Ads $12,605 $6,760 $19,365
Google Ads $12,200 $6,309 $18,509
Total ad spend $43,105 $21,869 $64,974
Blended return on ad spend (net revenue ÷ ad spend):
2025: 4.43x
2026 YTD: 5.13x
Combined: 4.67x
Ad efficiency improved between periods while net margin held steady at ~32%, indicating a stable and repeatable acquisition model rather than a one-off spike in performance.
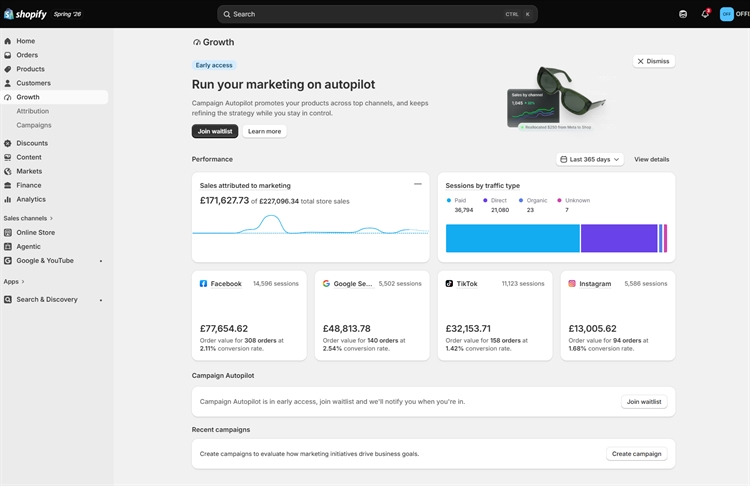
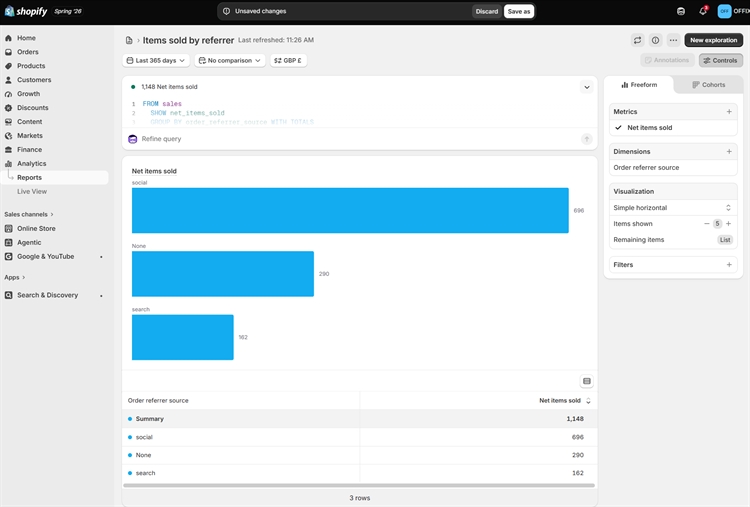
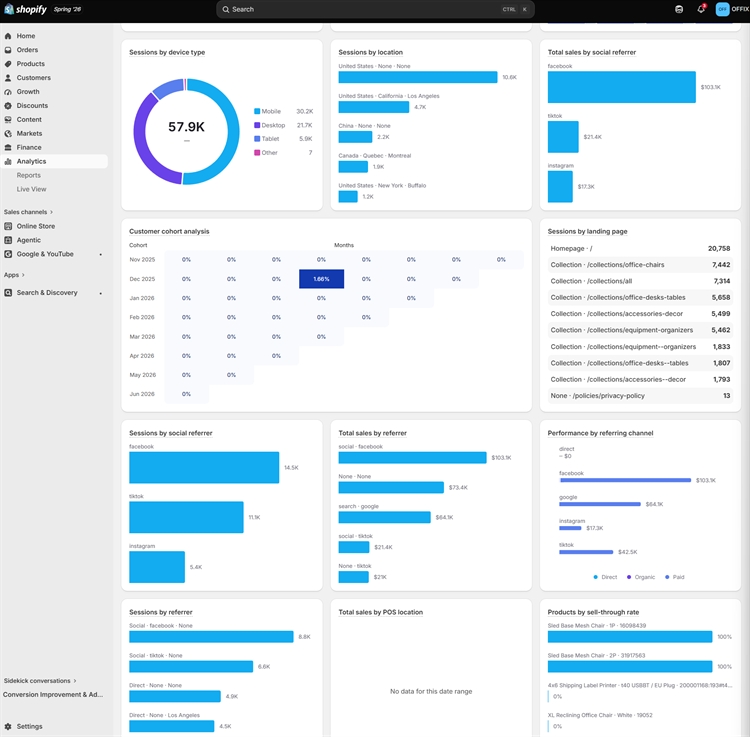
Shopify attribution by referring channel (trailing 365 days): Facebook $103.1K · Google $64.1K · TikTok $42.5K · Instagram $17.3K.
Traffic & Customers
Metric Value
Sessions (trailing 365 days) 57,904
Conversion rate 1.2%
Add-to-cart rate 2.99%
Reached checkout 2.12%
Orders 891
Average order value $386.07
Returning customer rate 0.22%
Traffic is predominantly mobile (30.2K of 57.9K sessions) and US-based, with secondary volume from Canada and Europe. The store is already configured for 30 countries across USD, GBP, EUR, CAD, and AUD.
Retention is currently negligible — repeat purchase rate sits at 0.22% and cohort retention is effectively flat. This is typical for a first-year furniture store with no post-purchase email programme in place, and it is the single largest untapped lever in the business. A customer list of 891 buyers is included in the sale with no email marketing having been run against it.
Revenue Pattern — Important for Buyers
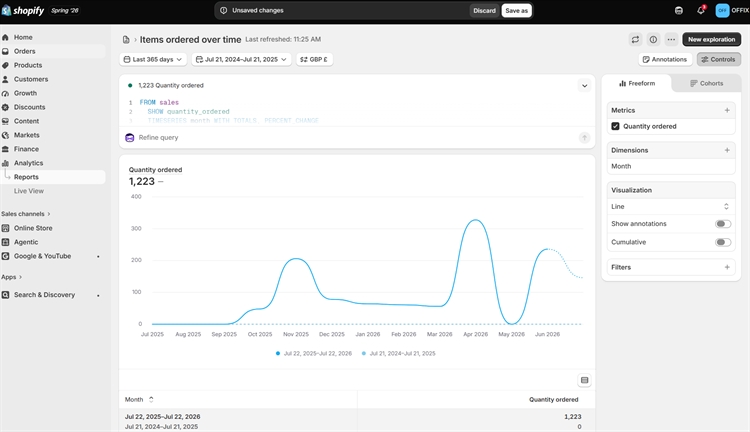
Revenue is not evenly distributed across the trading period, and buyers should model this carefully:
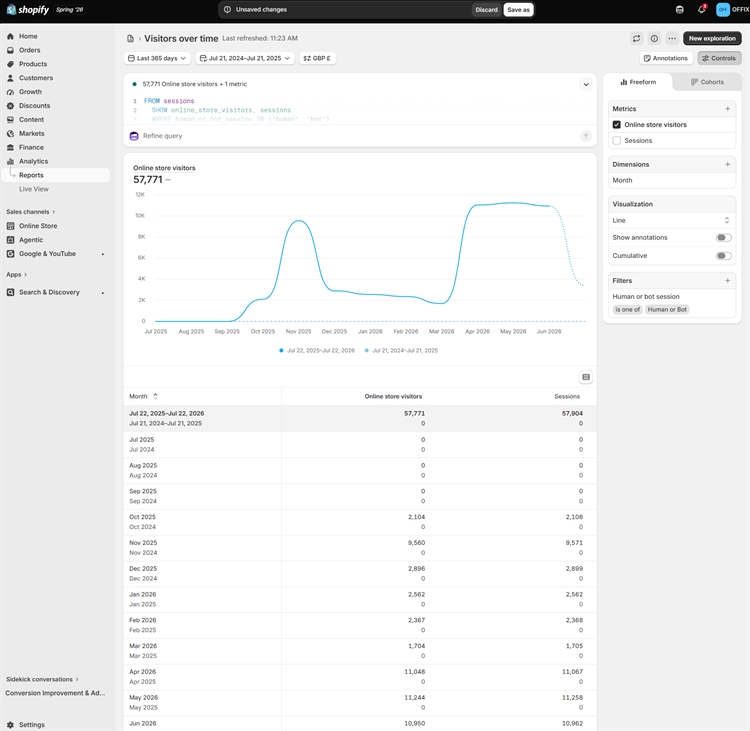
November 2025 alone generated $153,714 — 50.7% of all revenue to date, driven by peak-season Q4 campaigns.
December 2025 fell to $883 as campaigns were paused after the seasonal push.
2026 has traded more consistently: seven consecutive profitable months from January to July, ranging from $898 (May, campaigns paused) to $45,140 (April).
Every month with active advertising has been profitable. In months where campaigns were paused, fixed running cost is approximately $39.
The 2026 figures — $112,204 revenue and $35,913 net profit over seven months at a 32.0% margin — represent the more conservative baseline for valuation purposes, excluding the Q4 seasonal peak.
Cost Structure
Category 2025 2026 YTD Total
Cost of goods $76,716 $45,949 $122,665
Advertising $43,105 $21,869 $64,974
Staff $7,000 $8,200 $15,200
Hosting $195 $273 $468
Domain $40 $0 $40
Other $2,000 $0 $2,000
Total $129,056 $76,291 $205,347
Fixed overhead is $39/month (Shopify hosting). Everything else scales with sales volume or is discretionary.
Staffing: the business currently uses paid support staff ($15,200 to date) alongside a contracted marketing agency. This is not a fully hands-off asset — a buyer should plan either to retain this structure (the agency agreement transfers with the sale) or absorb the work in-house.
Technical Setup
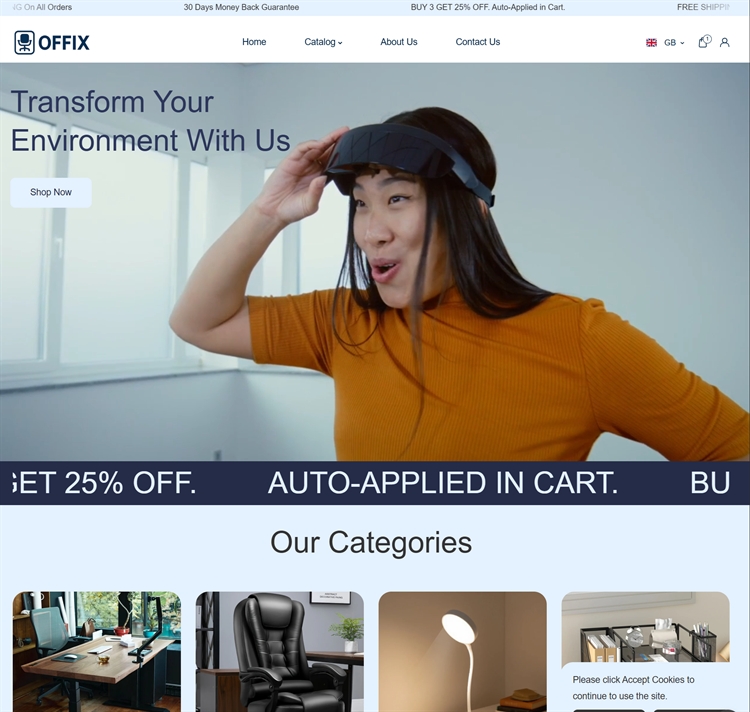
Platform: Shopify, custom-designed storefront with video hero sections and category merchandising
Design: Mobile-optimised, conversion-focused, built by loftwebs.com
Product range: Four curated collections with full product photography
Promotions: Automated "Buy 3, Get 25% Off" cart discount, free shipping, 30-day money-back guarantee
Markets: 30 countries configured across 5 currencies
Payments: Visa, Mastercard, Amex, Apple Pay, Google Pay, Shop Pay, Maestro, Union Pay, Discover, Diners, Bancontact
Policies: Privacy, refund, shipping, and terms of service all published
Included in the Sale
Domain name (offix.us)
Shopify store — full transfer of ownership
Brand assets — logo, branding guidelines, and all creative assets
Supplier relationships — introductions to all current suppliers
Customer list — email list of past customers and leads
Product images and all store settings
Ad accounts setup + TikTok Shop integration
Campaign structure guidance
Agreement and contract with the marketing agency, to ensure stable ongoing work after transfer
Analytics history — full Shopify and advertising account data
Transition support after closing — 30 days of support plus 10 structured lessons
Why the Owner Is Selling
The current owner is focused on other ventures and is not able to give OFFIX the attention required to scale it through the next peak season. The business is profitable, documented, and supported by a contracted marketing agency that continues after transfer.